Refined, Responsive, Repeatable:
My AI Framework for listing attraction, client conversion and workflow efficiency.
I use AI in nearly every part of my business—from attracting listings and converting leads to managing transactions and streamlining back-end operations. It’s become one of the most powerful tools I rely on to deliver high-touch, data-backed service with speed and precision. In fact, this message was drafted using AI based on the transcript from the video above, so I can show you in real time how I’m using it for this purpose.
When I prepare a property value analysis, I don’t just send over a static report. I record a Loom video where I speak directly to the seller while sharing my screen and walking through comps, market stats, and my pricing recommendations. I include clickable links in the video to a landing page that hosts all relevant data. Once the video is complete, I feed the transcript into AI, which generates a clean, well-structured email summary. I send this out with the video at the top for anyone who prefers to watch, and the written breakdown below for those who prefer to read. This approach has directly contributed to wins—like a recent $1.8M fourplex listing from a seasoned investor who told me it was the most innovative CMA he’d ever received.
AI also plays a huge role in lead conversion. Video lets me build trust quickly—it’s more personal and human than text alone. Using AI to turn those videos into polished email communication means I can follow up faster and with more clarity. I had a recent situation where a group of decision-makers had multiple questions about listing their duplex. I answered everything in a video message and used AI to generate a detailed summary underneath. They were so impressed, they canceled the scheduled Zoom and signed the listing paperwork immediately.
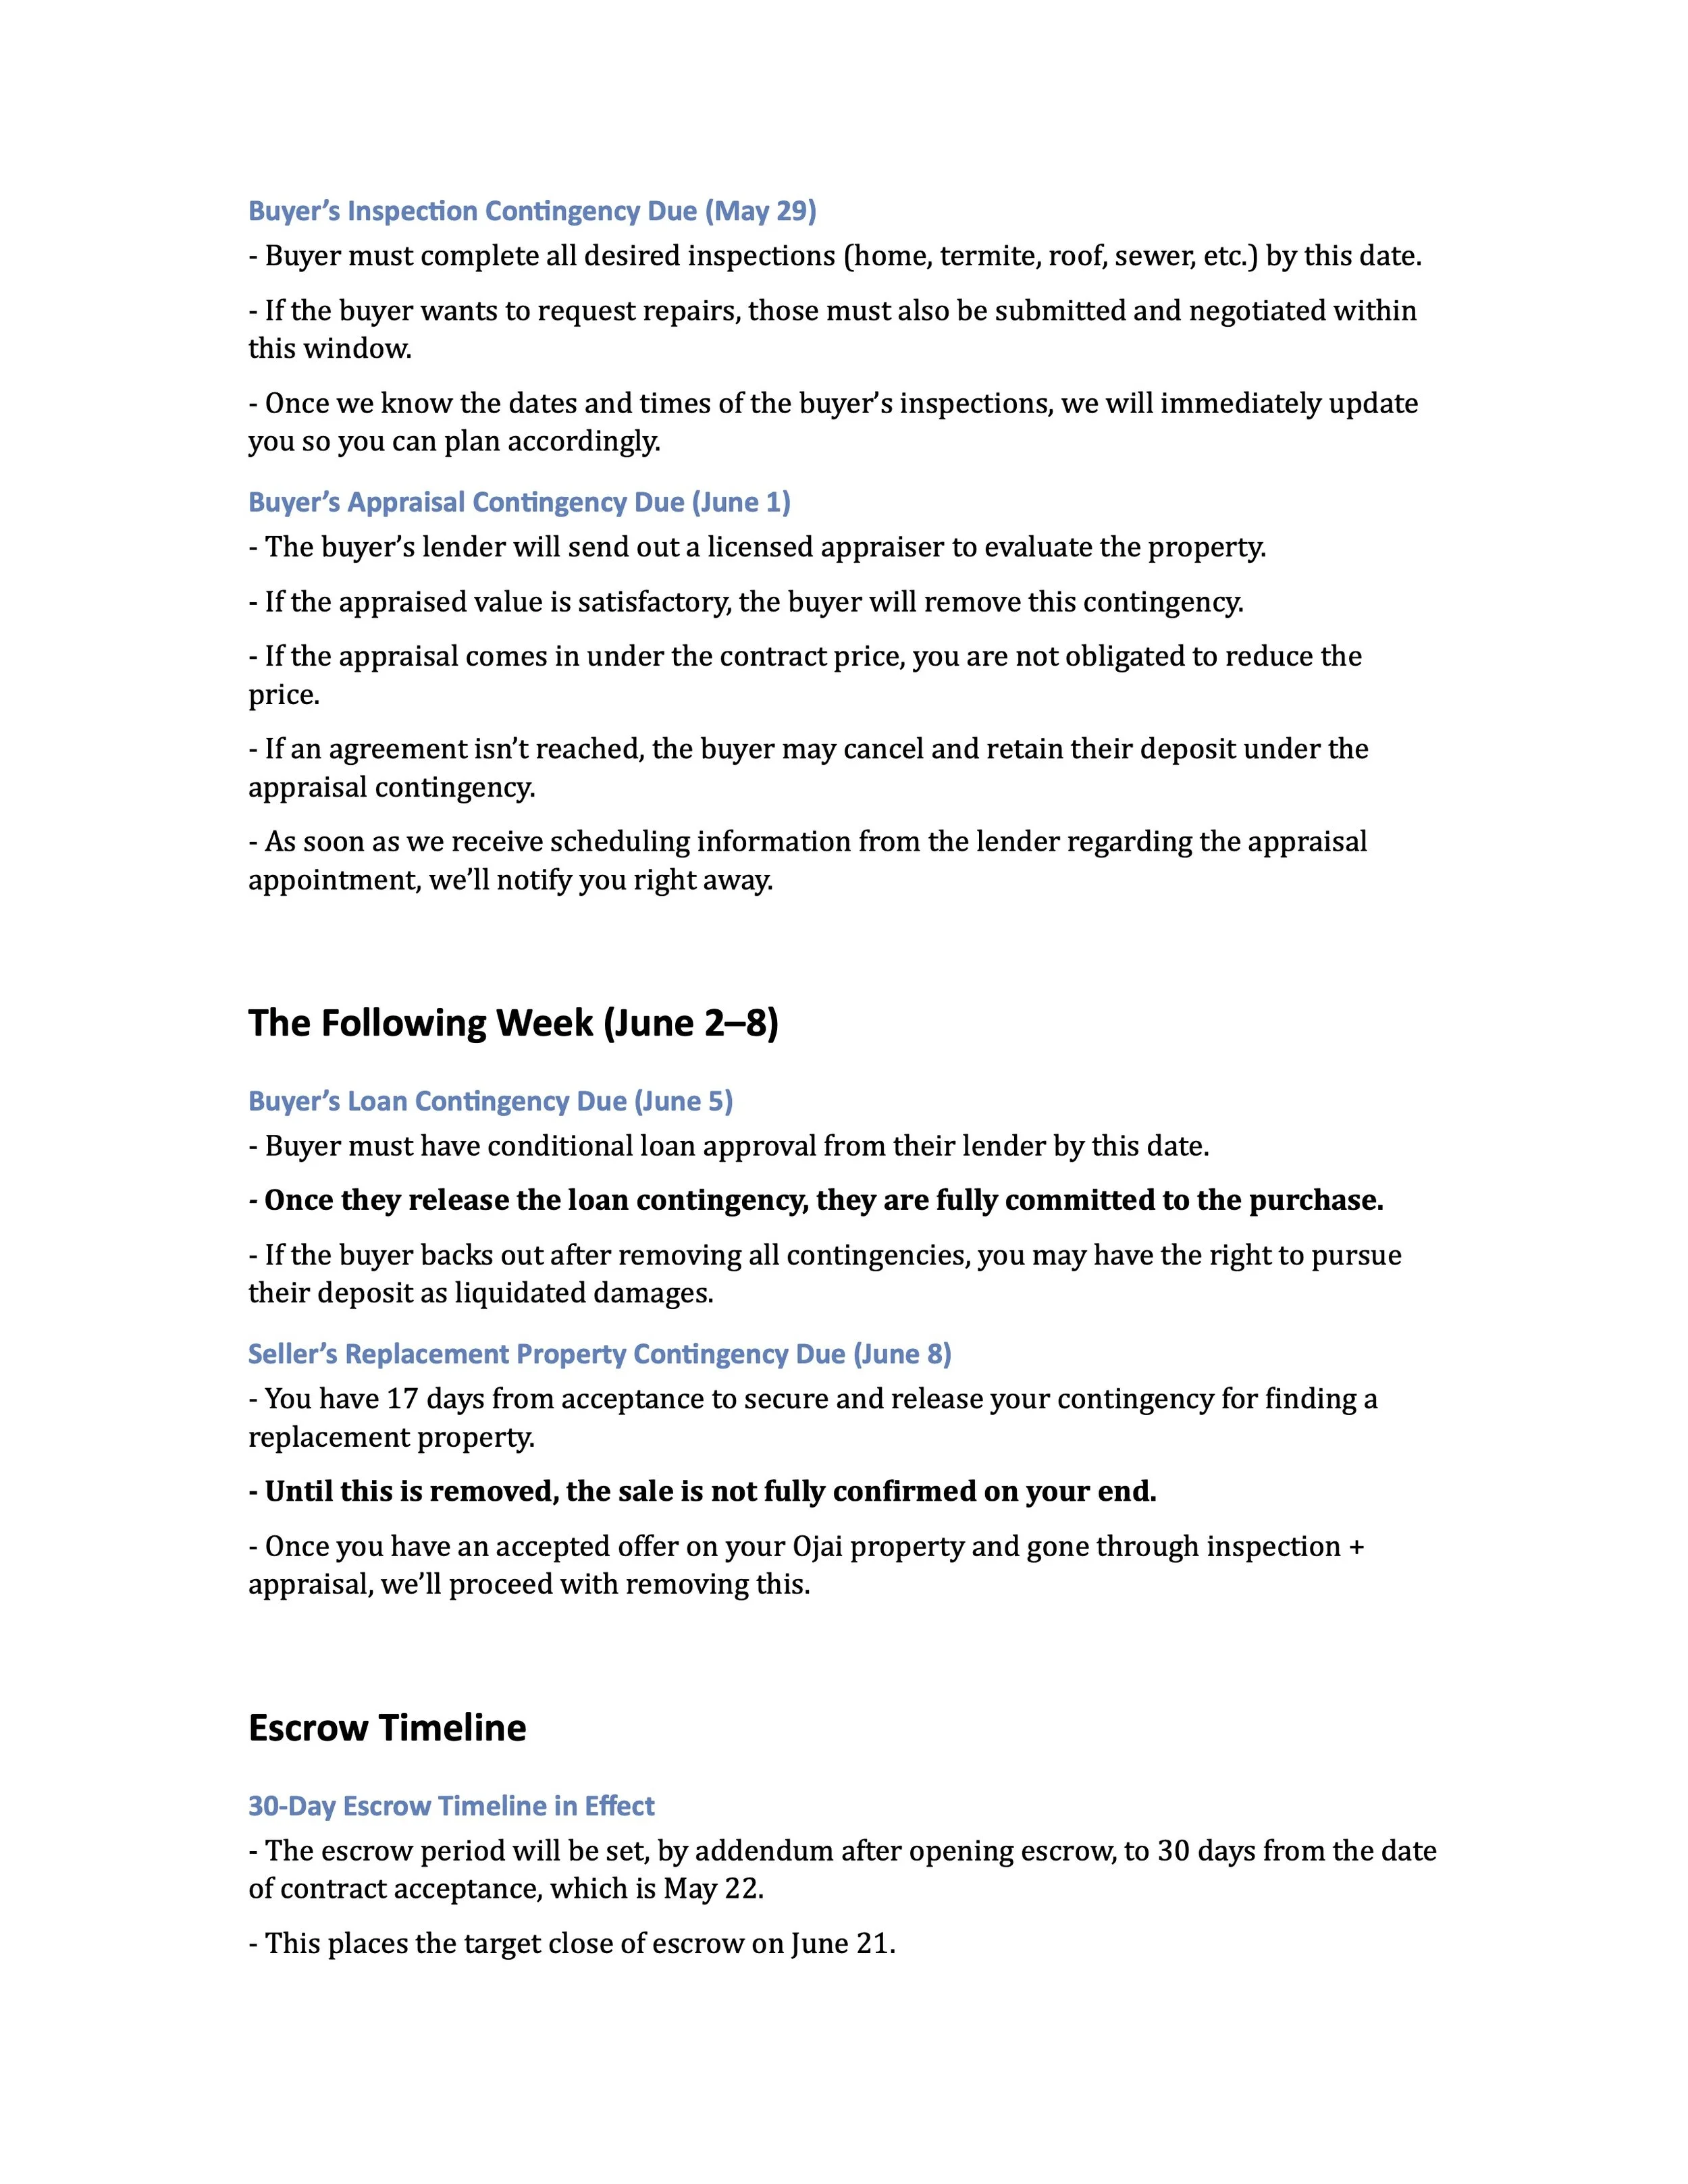
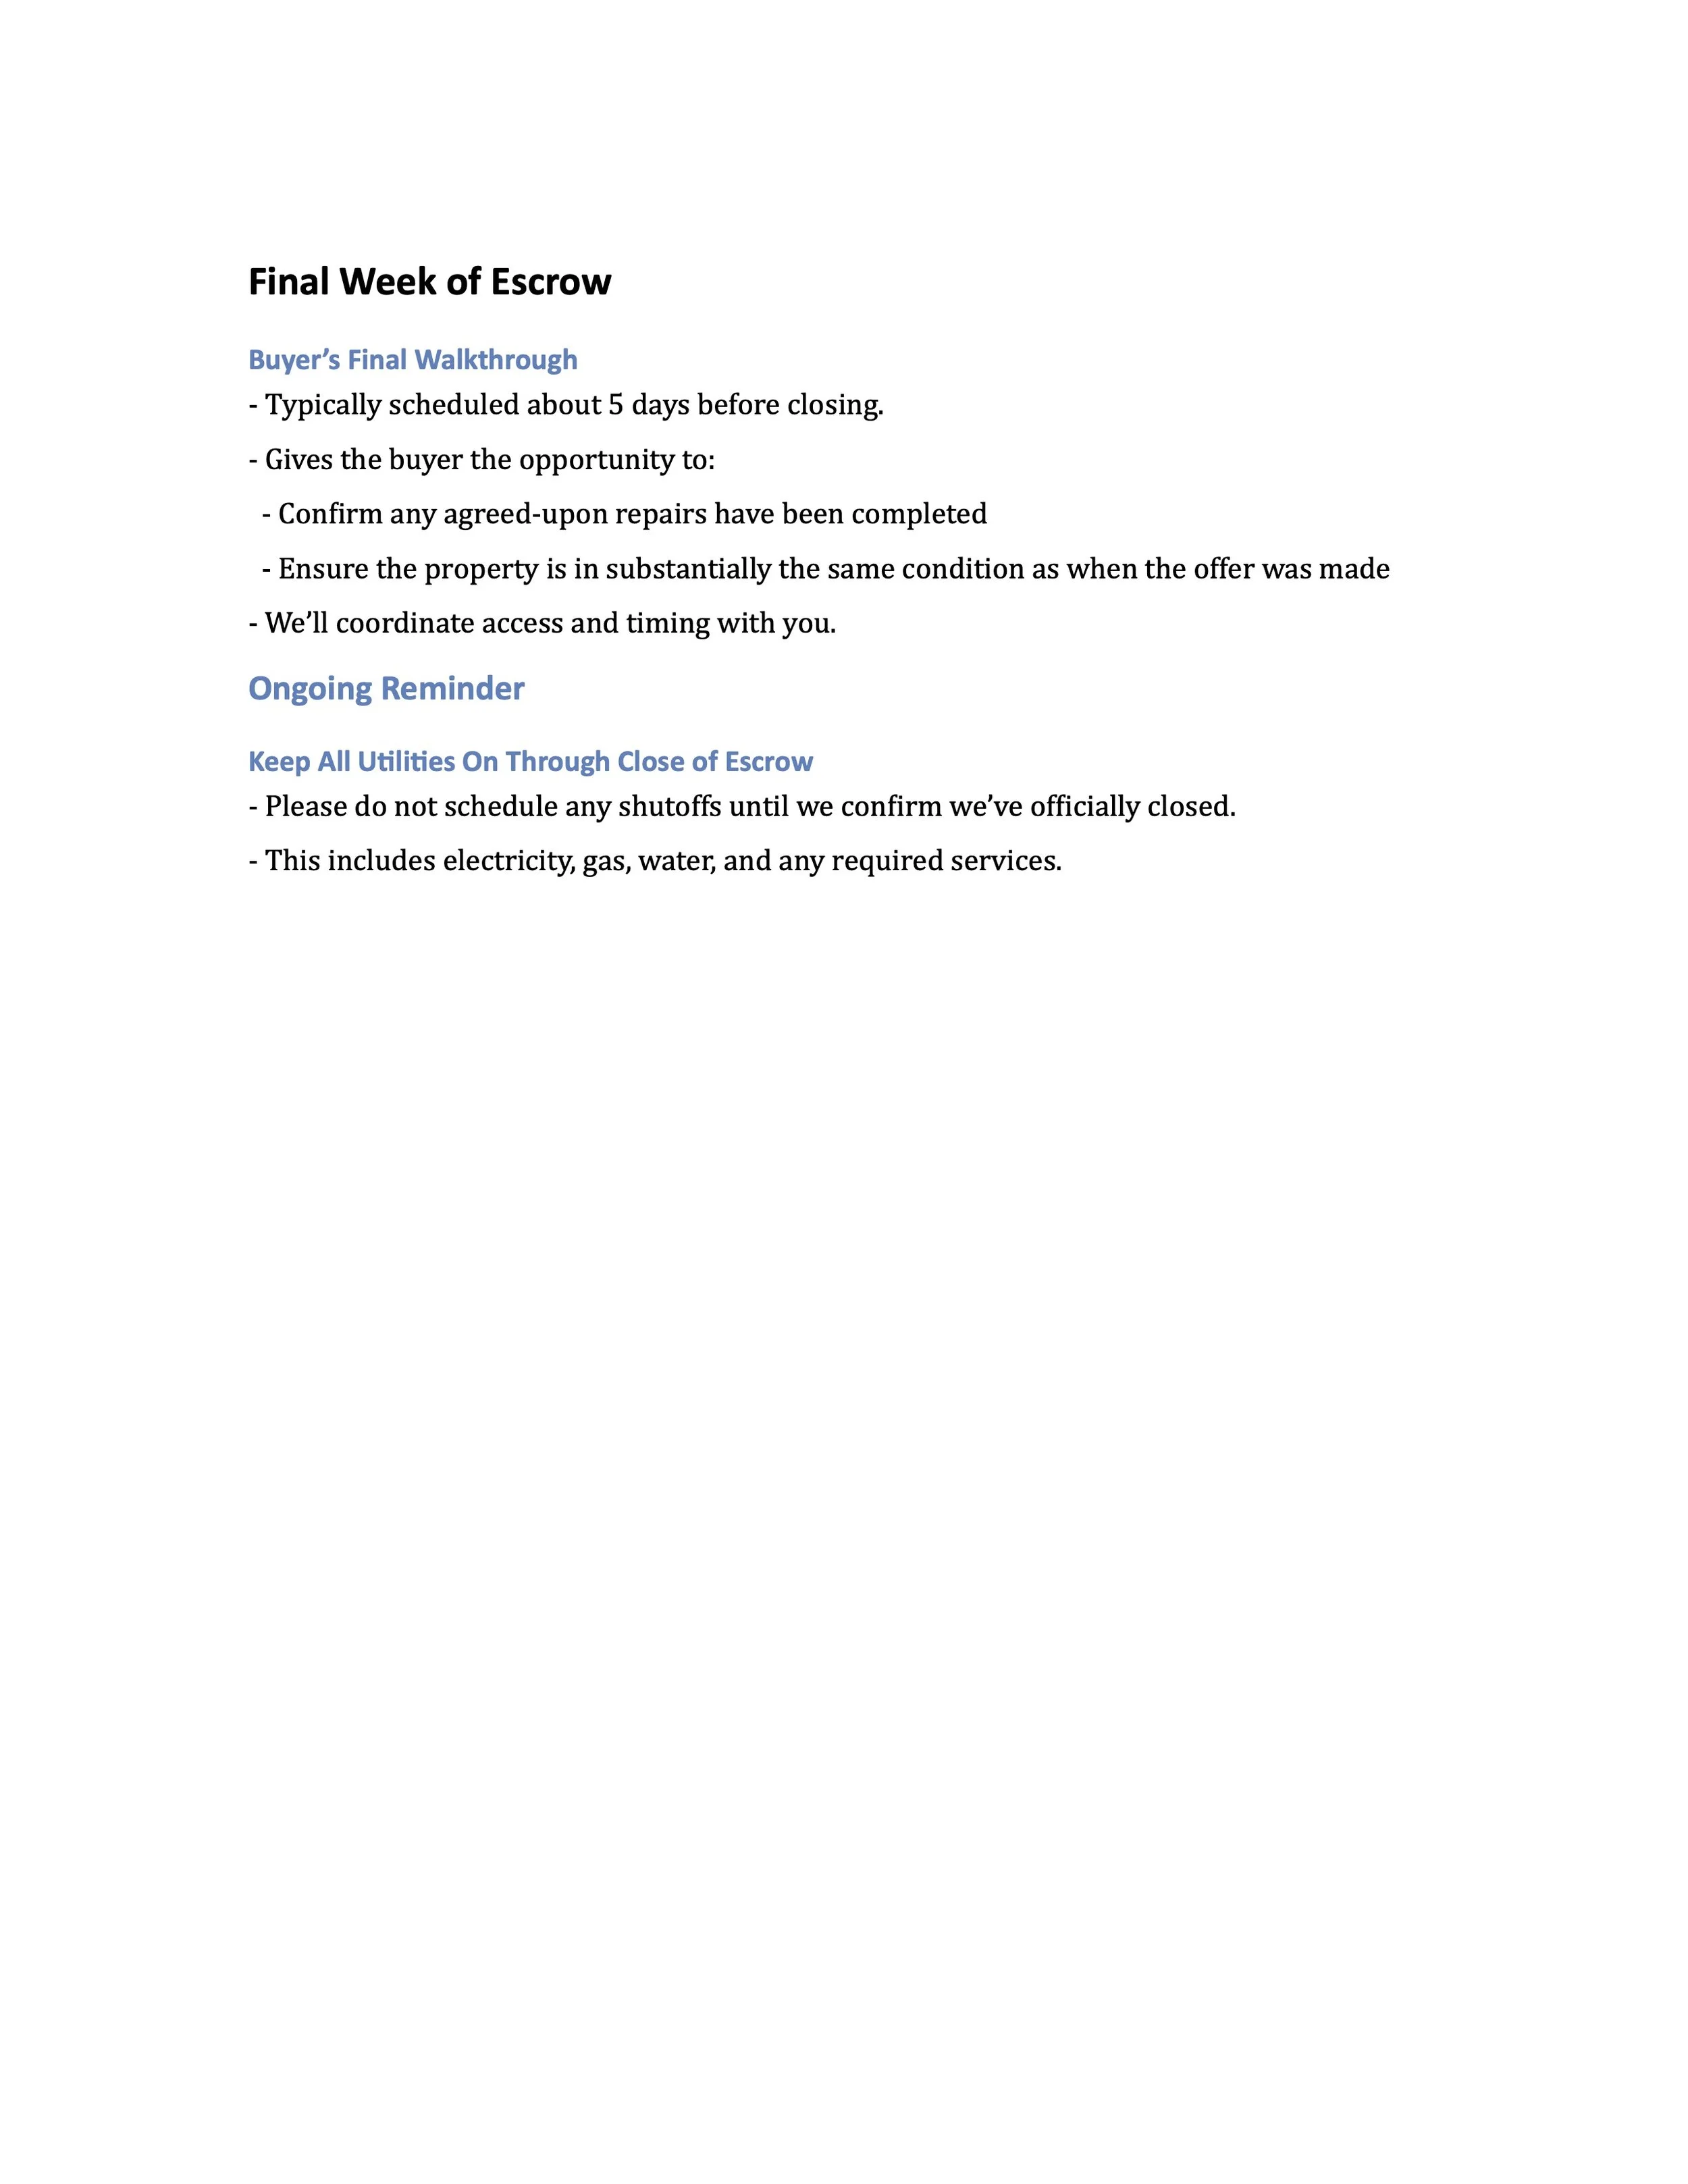
During escrow, I use AI to create tailored buyer and seller timelines. With one saved prompt and the contract dates, AI generates a week-by-week breakdown of the transaction, showing clients what’s happening now, what’s next, and what to expect. It’s simple, shareable, and doesn’t require anyone to log into a portal to stay informed.
AI also helps me with documentation and due diligence. I upload home inspection reports and use AI to cross-reference them with contractor or termite bids to ensure that flagged issues are properly addressed in vendor estimates. In one case, this process saved a client money by identifying duplicate charges for the same repair from two different vendors. When I receive lengthy HOA packets, I run them through AI as well, allowing me to quickly locate specific information like rental restrictions, pet policies, pending assessments, or litigation notices—without having to manually sift through the entire packet.
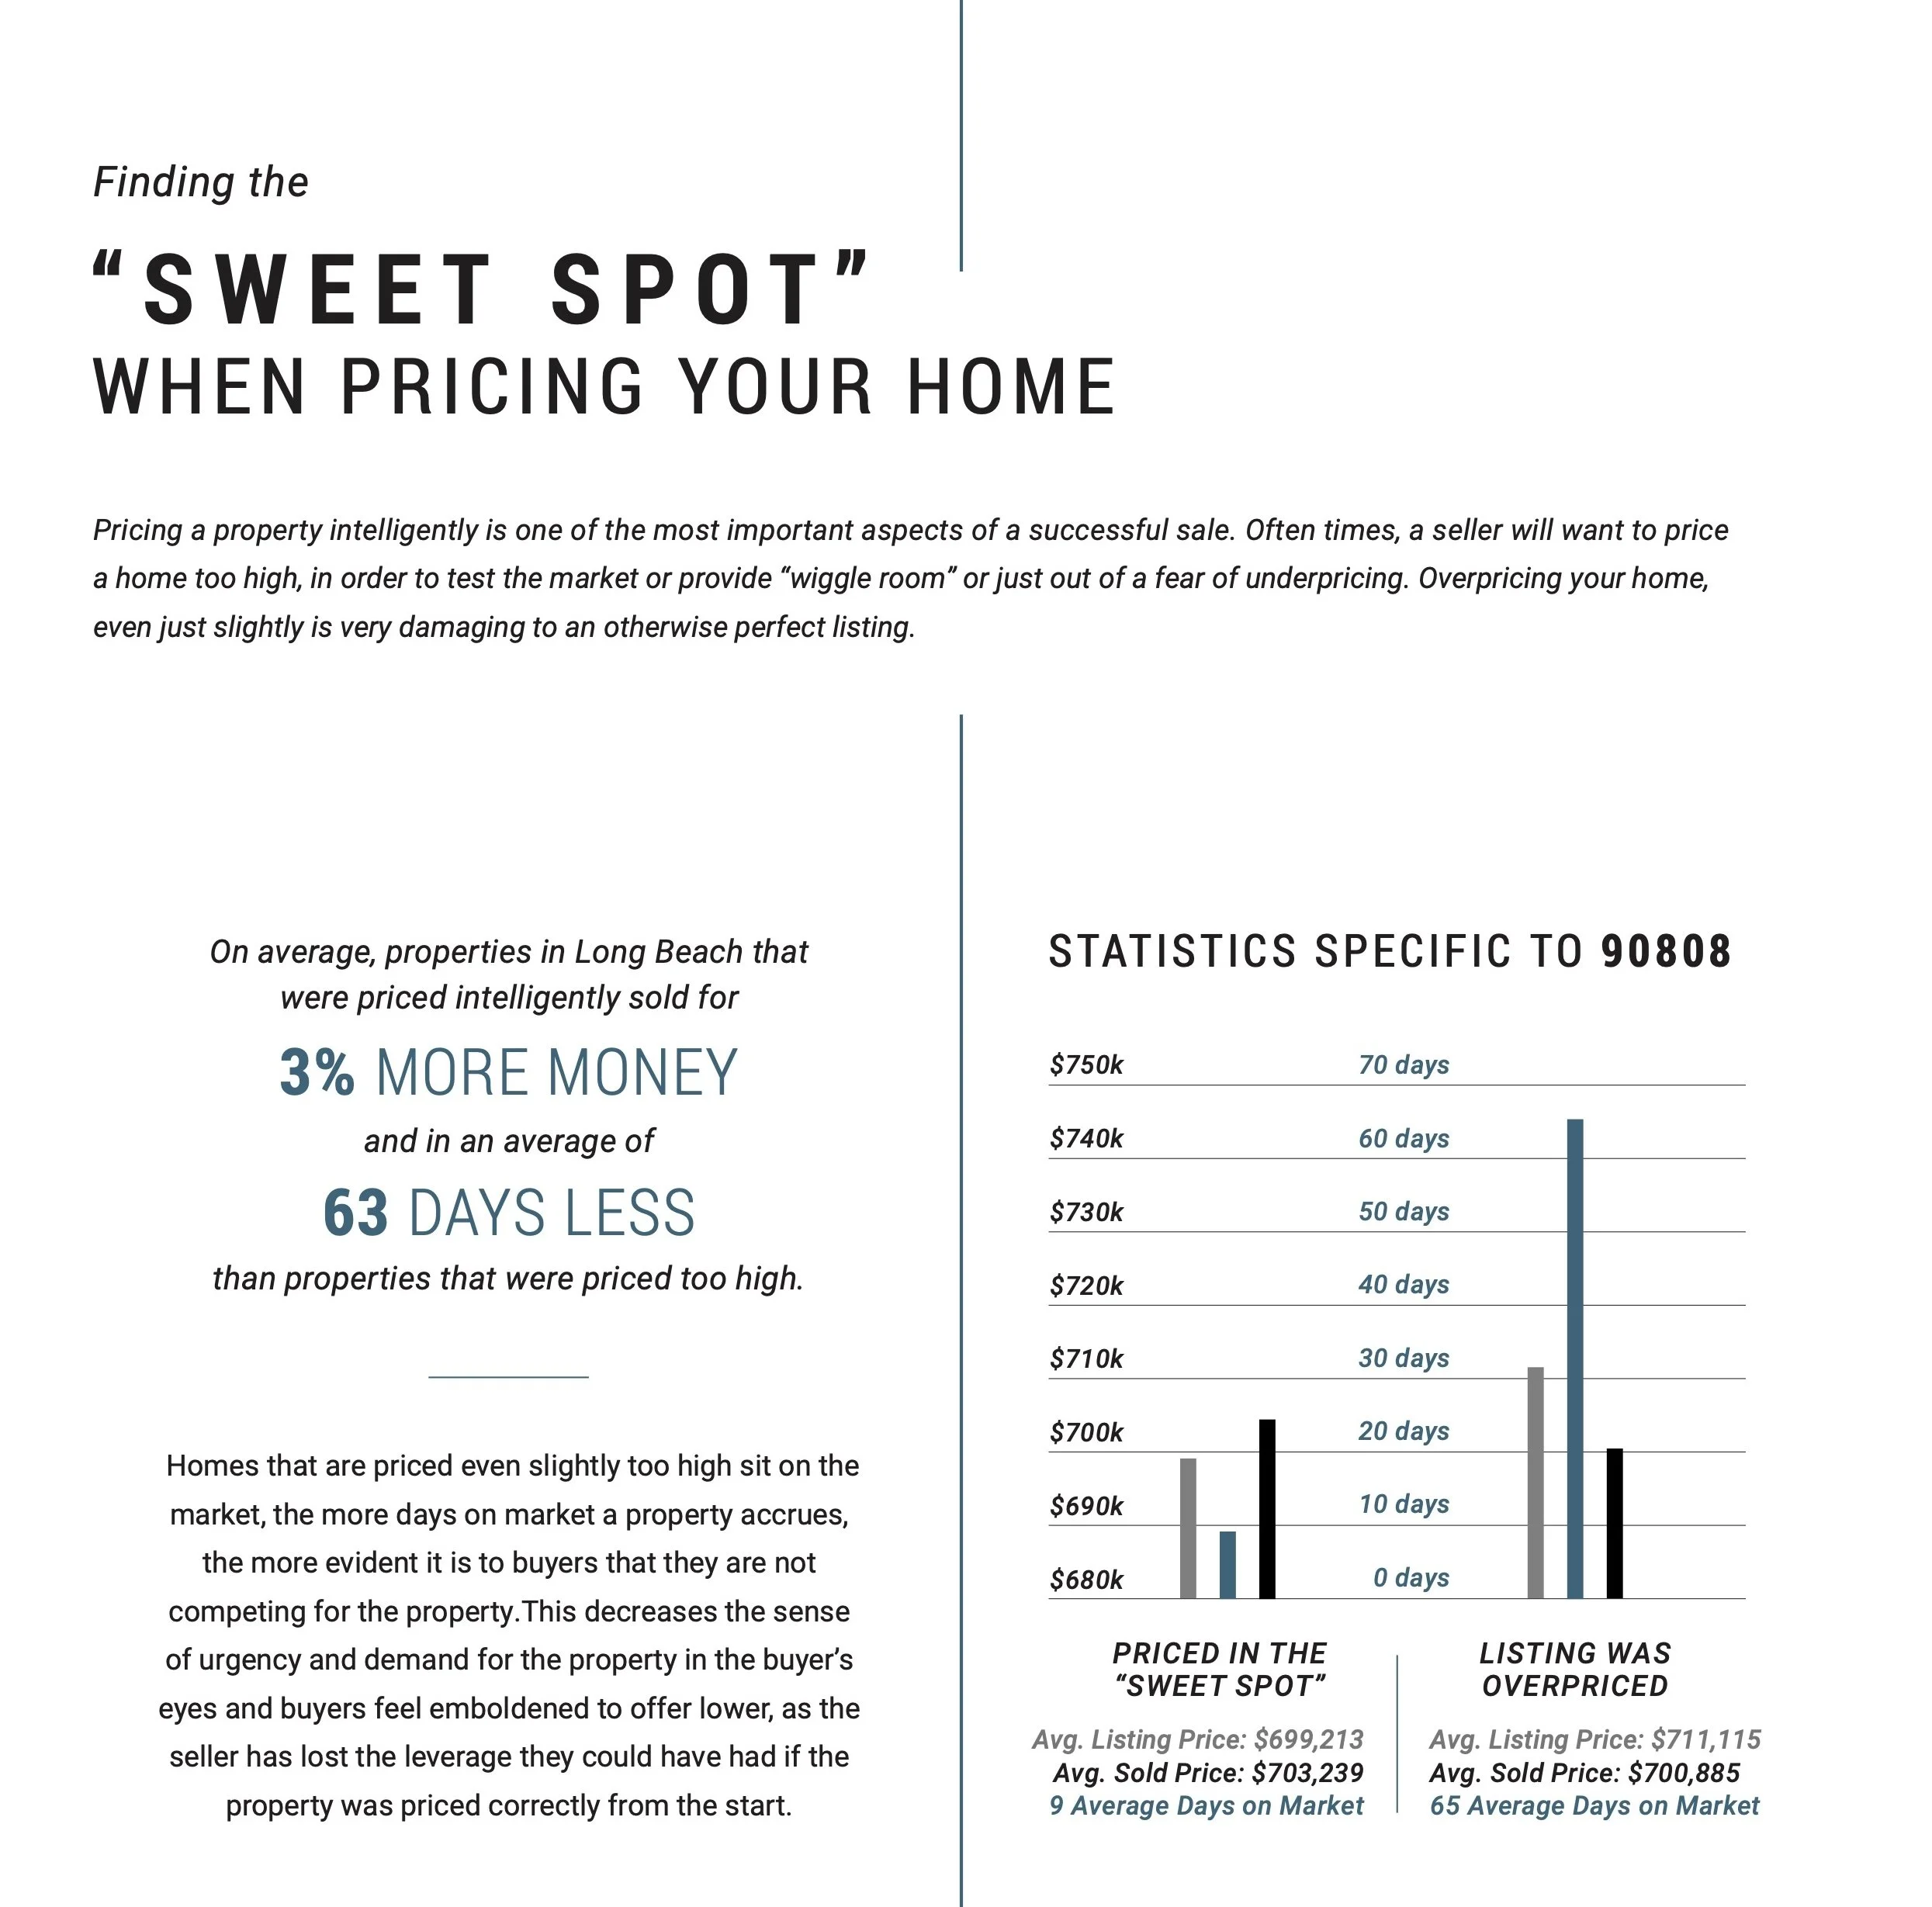
On the pricing side, I use AI to generate data-rich visuals that clearly show trends in list-to-sale ratios, especially the relationship between pricing and days on market. This allows me to present sellers with evidence-based recommendations rather than just opinions. For properties that are hard to comp—like oversized homes or listings planned years into the future—I use AI to analyze MLS data and calculate how non-linear pricing factors, like square footage, affect value in specific neighborhoods.
From listing presentations to closing strategies, AI has transformed how I work. It enables me to deliver a faster, smarter, more personalized experience to my clients—and in this market, that’s what makes all the difference.
the video cma that won me a $1.8M listing
This video transcript below the video embedded below was generated using AI to clearly and efficiently communicate key points, allowing the seller to absorb a large amount of information quickly and positioned me as the expert on the market and an efficient communicator.
Hi Jesus, thank you for your patience on this. I wanted to take the time to analyze and pull together as much relevant information as possible before sharing my evaluation. Similar to my last approach, I’m combining both a comparable sales analysis and a cap rate strategy to determine value and pricing recommendations for your investment property.
Here’s a breakdown of the comparable sales I reviewed:
Orizaba (Active)
Inferior location (further north and west)
~50% larger building, double lot size
Poor marketing, low-quality photos
Gross income: $97,240 | Net: $68,852
On market for 91 days
Toledo (Pending)
Initially overpriced, sat for 216 days
Reduced to $1.8M and went under contract quickly
Larger lot and building
Gross income listed incorrectly—actual income appears closer to $120,000
Final price pending agent response
Redondo (Sold)
4,700 sq ft building
Mixed unit types, including two 3-bed/2-baths
Gross income: $109,500
Closed at $2,000,000 after listing too high initially
Broadway (Sold)
3,900 sq ft building
Gross income: $132,000 | Net: $87,000
Listed at $1,895,000 | Sold at $1,950,000
Strong example of pricing within the sweet spot
Corona (Sold – Most Comparable)
Very similar location, unit mix, and lot size
No garage, just carports (you have a two-car garage)
Gross income: $98,040
Closed at $1,778,000 after multiple price reductions
Peninsula (Sold)
Similar size but distressed condition
All one-bedroom units with no parking
Superior location, but not comparable in quality
Your gross income is $96,000, and your net after taxes and expenses is $76,741. If we list at $1,795,000, the cap rate is approximately 4.25%, which is below both the average (5.0%) and median (4.5%) for Area 2 fourplexes over the past six months. That’s a favorable position for you.
I recommend listing at $1,795,000. It places us just above the most relevant comp while creating room to drive the sale into the low $1.8s. Overpricing risks a long time on market and eventual price reductions, especially in a climate with high rates, flat rents, and buyer hesitation. With strong marketing, I believe this strategy gives us the best chance at maximizing value without losing momentum.
seller timeline generated by ai
This custom chart below, tailored to our seller’s home, illustrated the strong correlation between shorter days on market, higher sell-to-list ratios, and strategic pricing—ultimately helping us secure a competitively priced listing that attracted multiple offers and yielded a higher profit than aspirational pricing would have. We used AI to crunch the raw data from the MLS to arrive at these statistics.
I used AI to analyze the relationship between square footage and sales price for a property that was particularly challenging to comp, illustrating the non-linear nature of price per square foot and helping me forecast the value impact of its significantly larger size compared to smaller homes in the area, as it was a clear outlier. Below is an excerpt from that analysis.
“I analyzed the correlation between square footage and sales price using a sample of comparable sales. The correlation coefficient came in at 0.47, indicating a moderate positive relationship—meaning that, generally, as square footage increases, so does sales price. In this case, square footage accounts for a 22% positive correlation with price.
While factors like condition and location also play important roles, many of the comps in this sample include homes with superior finishes (such as fully remodeled kitchens) and a range of locations—from more desirable areas south of 3rd and Broadway to less desirable ones north of 4th. Given that variability, I think it’s reasonable, for the purposes of this analysis, to isolate square footage as the primary valuation factor.
Based on that single variable, and using this comp set, your home’s estimated market value today is approximately $1,139,435. That aligns fairly closely with Zillow’s estimate of $1.2 million. Redfin, on the other hand, estimates $1.4 million, but in my experience, their model often skews high relative to actual market conditions.
Since you’re not listing the property today—and given that we’re seeing increased days on market and more frequent price reductions—I wouldn’t recommend pushing the valuation much higher than this data suggests. Because this analysis is being used to forecast future value and inform your long-term financial planning, I believe a conservative, data-driven estimate is the most responsible approach. It gives us a grounded baseline without overinflating expectations, which is especially important when projecting retirement savings.”